
Page 133 - TLAA Annual Report 2024
P. 133
จากตารางที� 1 ข้อุมูลสถึิติธุุรกิจปัระกันชีีวิิต ระหวิ่างปัี 2563 - 2567 Table 1 illustrates the life insurance industry’s growth
แสดงให้เห็นภาพการเติบัโตขอุงธุุรกิจปัระกันชีีวิิตเทียบักับั relative to Thailand’s economy. In 2024, total premiums
การเติบัโตขอุงเศัรษฐกิจ โดยในปัี 2567 เบัี�ยปัระกันภัยรับั reached THB 653,923 million, with an in-force policy
รวิมทั�งสิ�น 653,923 ล้านบัาท อุัตราควิามคงอุยู่ขอุงกรมธุรรม์ ratio of 83% and 26.4 million policies in force. GDP
ที�ร้อุยละ 83 จำานวินกรมธุรรม์ 26,425,786 ฉบัับั ในขณะที�อุัตรา growth stood at 2.6%, while insurance penetration
การเติบัโตขอุง GDP อุยู่ที�ร้อุยละ 2.6 สัดส่วินเบัี�ยปัระกันภัยต่อุ (premiums to GDP) was 3.56%—similar to previous
GDP (Insurance Penetration) ร้อุยละ 3.56 ใกล้เคียงกับั years. Insurance density (premium per capita) reached
ชี่วิงปัีที�ผ่านมา (ปัี 2563 - 2566 ร้อุยละ 3.83, 3.79, 3.52 THB 9,767, and policy ownership rate (number of
และ 3.53 ตามลำาดับั) ในขณะที�สัดส่วินเบัี�ยปัระกันชีีวิิตต่อุ policies per population) was 40.01%, aligning closely
จำานวินปัระชีากร (Insurance Density) คิดเปั็น 9,767 บัาทต่อุคน with past years. Though growth continues, the
และอุัตราการถึ่อุครอุงกรมธุรรม์ (No. of Policies per insurance-to-GDP ratio remains relatively low,
Population) ซื้ึ�งมาจากจำานวินกรมธุรรม์ฯ ต่อุจำานวินปัระชีากร highlighting further room for development.
อุยู่ที�ร้อุยละ 40.01 ซื้ึ�งมีสัดส่วินใกล้เคียงกับัชี่วิงปัีที�ผ่านมา
(ปัี 2563 - 2566 ร้อุยละ 43.04, 39.57, 40.36 และ 40.23
ตามลำาดับั) จากข้อุมูลข้างต้น แม้ธุุรกิจปัระกันชีีวิิตจะมีอุัตรา
การเติบัโตเพิ�มขึ�น และด้วิยสัดส่วินเบัี�ยปัระกันภัยต่อุ GDP
ยังค่อุนข้างเล็กหากเทียบักับัภาคการเงินอุ่�น หากมอุงในด้านดี
แล้วิจึงถึ่อุเปั็นโอุกาสขอุงภาคธุุรกิจที�จะสามารถึพัฒนาการ
เติบัโตไปัได้อุีก
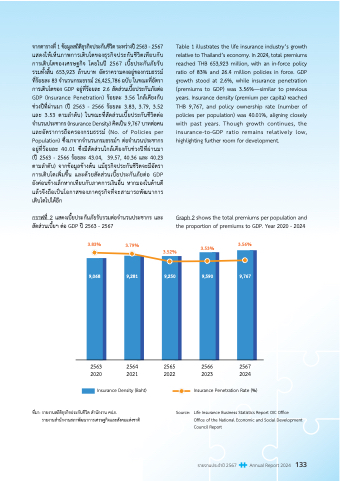
กราฟ้ที� 2 แสดงเบัี�ยปัระกันภัยรับัรวิมต่อุจำานวินปัระชีากร และ Graph 2 shows the total premiums per population and
สัดส่วินเบัี�ยฯ ต่อุ GDP ปัี 2563 - 2567 the proportion of premiums to GDP. Year 2020 - 2024
3.83% 3.79% 3.56%
3.52% 3.53%
9,068 9,281 9,250 9,590 9,767
2563 2564 2565 2566 2567
2020 2021 2022 2023 2024
Insurance Density (Baht) Insurance Penetration Rate (%)
ที�มา: รายงานสถึิติธุุรกิจปัระกันชีีวิิต สำานักงาน คปัภ. Source: Life Insurance Business Statistics Report OIC Office
รายงานสำานักงานสภาพัฒนาการเศัรษฐกิจและสังคมแห่งชีาติ Office of the National Economic and Social Development
Council Report
รายงานประจำาปี 2567 Annual Report 2024 133